
Here we go! The first thing to do is recovering the financial statements of the company that we have chosen. A good idea is to choose a company within our circle of competence (10. Circle of competence).
What we are going to learn:
- Read an income statement at a glance
- Focus on the fundamental numbers
- Extrapolate some metrics
- Contextualizing the numbers
The goal is to find the best compounder with a competitive advantage.
As in the previous article, I will take, again, Facebook (FB) as an example. The first thing to do is to go on Google and digitize “FB investor relations”. Once we are in the investor page we have to open the last earnings release and search for the Statements of Income.
Like I explained in the preceding article (12. Starting Point), there are plenty of platforms that allow us to retrieve the data in a more comfortable set up (e.g. quickfs.net or tikr.com). It is always a good thing to check the datas on official sources like EDGAR. EDGAR is the official SEC (US Security and exchange commission) where we can find official documents on companies.
The best tool we need for developing quantitative analysis are the Financial statements, remember the past article about stories and numbers. (11. Stories and numbers)
“Accounting is the language of business”
Warren Buffett
When I started my journey in the world of investing, I was afraid about accounting. I started with zero knowledge about this language, but I rapidly noted that not all data is useful. At least, to start, we can have a first idea about a company by looking at a few numbers. If your knowledge about accounting is zero or very minimal, I’ll suggest you to read:
by Mary Buffett
Or, if you prefer an educational video:
A series of educational videos realized by Prof. Aswath Damoradan (Stern University, NY) Accounting 101
With the following example, I want to analyze with you some useful financial figures, easy to understand even without a CFA. Our aim is to become practitioner investors, not employees of an accounting firm. My goal is to distill the meaningful parts of the process, in order to craft our thesis in a simple manner without too much noise (First principle thinking, remember, when we will talk about Mental models).
The final destination is to find companies with strong competitive advantage (14. It’s a war) at a fair price, to buy, hold and let them compound over the long term.
“If the job has been correctly done when a common stock is purchased, the time to sell it is almost never.”
Phil Fisher
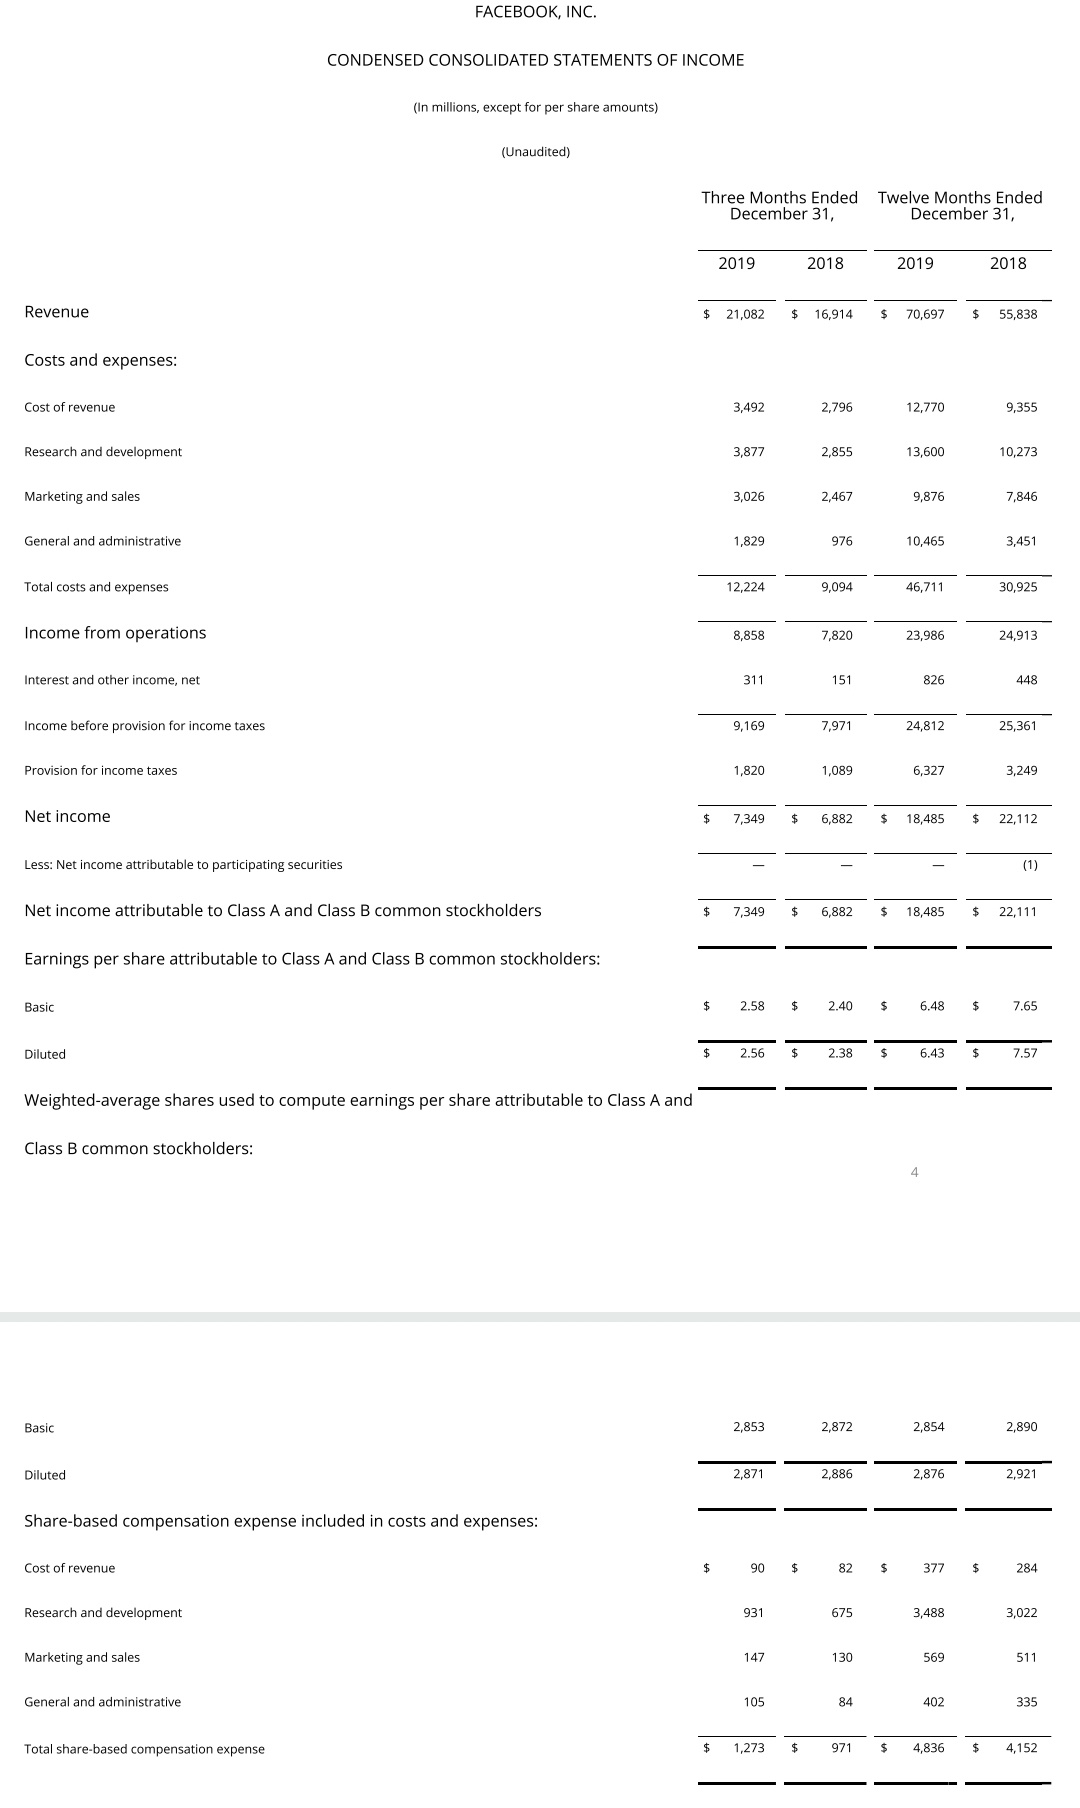
The best is to analyze multiple years of financial, 10 years ideally. In this manner, we can track the number history of the company, and glimpse the evolution over time. In other words, it defines if the company is in healthy condition, and if it is growing overtime. It is good to remember that at the end of the day we have to mix numbers with stories and the two things have to fit each other. Stories give sense to numbers and to the prospects of the business.
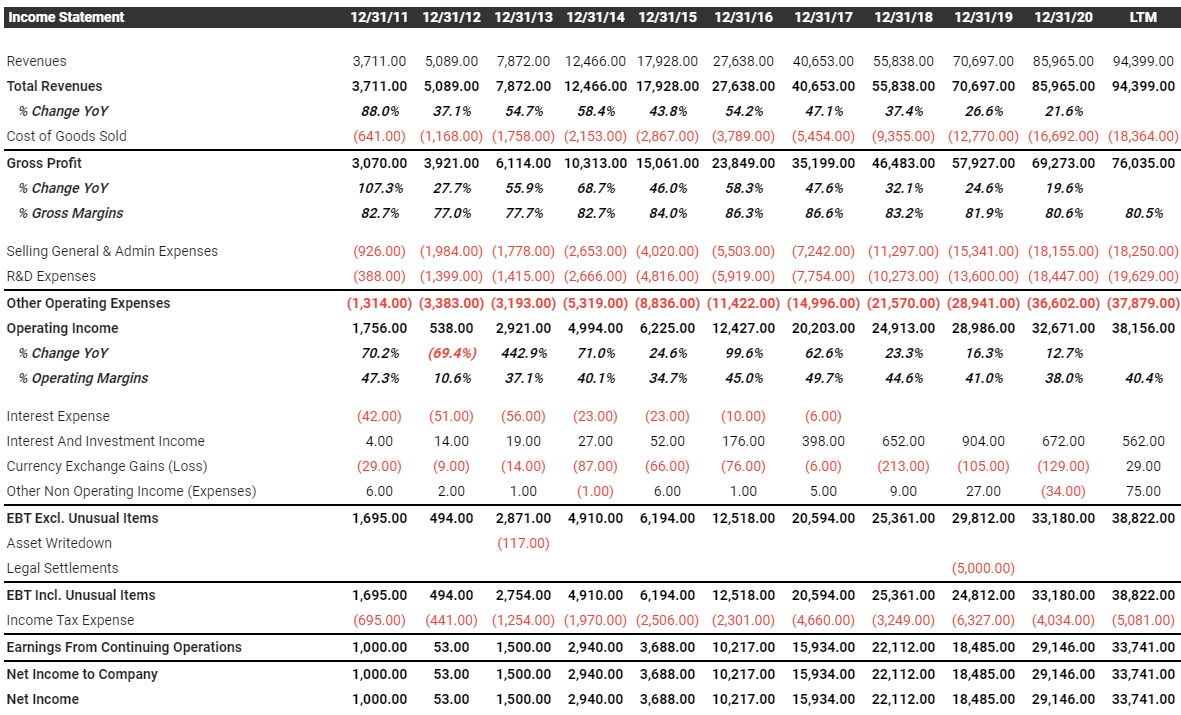
Income statement is the first statement we are going to analyze. It is also known as a profit and loss statement (P&L). It tells us what is going on in the company in terms of revenue, and how this revenue gets transformed into profits during a particular period.
Income statement provides information on the revenues and expenses of the firm, and the resulting income made by the firm, during a timeframe.
Including non-cash expense as:
- Amortization = Expensing the cost of intangible assets (brand, intellectual property, patents, copyright, trademarks,…) over the projected life of the asset.
- Depreciation = the same of Amortization, but with tangible assets (computers, office furniture, trucks, buildings).
These are defined non-cash expenses, because the cash costs are already deducted from Cash Flow in full when the item was purchased and immediately represented in the Cash Flow Statement (Cash accounting). The current cost represented in the income statement is the spreading of the cost incurred over the useful life of the asset (Accrual Accounting), thus defined as non-cash expenses. That point is going to be recalled when we will calculate a range of prices for our company.
Look at the top line!
Top line is a jargon that refers to the top number of the income statements. If you look at the fig.1 you can see the Revenue, and that is the raw fuel of the company.
Why raw?
Because the real fuel has to be processed, there is a lot of work the company has to do in order to generate profit. It has to deduct the cost of its work to obtain the gain that belongs to us, as the owners.
But the fuel of our company is not our money?
The best company where we invest our money is a company which doesn’t really need our money, in other words it’s financially self-sufficient. As owners, we receive money from it and not stoking the fire with our cash. We want a cash machine not a money burner!
What defines the profitability of the company?
Revenue obviously, but above all the qualities of those revenue. They depend on the efficiency of the company. A good company led by a good management will generate cash with low friction (costs).
The first place to look is COGS (Cost Of Good Sold), namely how much we have to pay for the materials needed to assemble the products/services we are going to sell. When we subtract COGS from revenue we obtain gross profit.
Why gross?
Because our engine (company) takes energy (cash) to develop the business. For example: marketing, R&D (research for developing new products), cash for acquiring other business to consolidate the position as market leader, etc. This deduction will come in the following lines of the statement. Anyhow the gross profit already tells us a lot of stuff about the company.
(Revenue-COGS)/Revenue gives the % margin of gross profit, that is how much profit from sales we retain. What we are looking for are companies that increase the % of profit that it can retain. Every sector of the economy has a different margin because, for example, a steel company has a lot to pay for raw material than a software company that is service oriented. Businesses with high scalability have high gross margins, because every addicted unit of product doesn’t add any fixed cost. Software industry is a great example.
Gross margin tells us whether if a business has a competitive advantage, particularly if the product or service delivered is sufficiently needed by customers that they are willing to pay over the price to get the product (Pricing power), however a company could have price power from the supply side. If the company is a big customer of a supplier, can bargain with him in order to obtain discounts on raw material or manufactured products, that depends on the scale. A good example is Apple. Apple has a strong brand so people are willing to pay a high price for an iPhone despite the fact other companies sell way cheaper comparable products. Other than that, Apple is the main customer of Taiwan Semiconductor (Semis foundry), which should give to Apple bargaining power in terms of pricing.
Without pricing power, competitors will enter the markets and those would easily steal customers only by lowering the price, in this environment nobody will have an advantage then the gain on the product would be eroded. That is for the joy of the customers but not for the owners of the company (e.g. price discounts to improve sales).
In marketing this is named Mindshare, that is the amount of consumer awareness or popularity surrounding a particular product or brand.

“To see that every man in uniform gets a bottle of Coca-Cola for 5 cents, wherever he is and whatever it costs the Company.”
Robert Woodruff, $KO president, 1923-1954

“Before 1931, there were many different depictions of Santa Claus around the world, including a tall gaunt man and an elf — there was even a scary Claus.
But in 1931, Coca-Cola commissioned illustrator Haddon Sundblom to paint Santa for Christmas advertisements. Those paintings established Santa as a warm, happy character with human features, including rosy cheeks, a white beard, twinkling eyes and laughter lines.
Sundblom drew inspiration from an 1822 poem by Clement Clark Moore called “A Visit from St. Nicholas” — commonly known as “Twas the Night Before Christmas.”
www.coca-colacompany.com
I’m sorry kids, but your Santa is an advertising experiment, and you are the result of that mind experiment!
Pricing power is even more important when inflation comes, because it permits to transfer the increase in price (raw material + labor) to customers and to increase shareholders value, thus protecting owners wealth. Usually price power is developed through marketing, in this statement we can see how much the company spends for marketing. A brand when created through marketing it becomes an intangible asset, an asset that can become stronger over time and doesn’t need maintenance, thus when inflation comes this asset generates cash without reinvestment needs (which would be high in a inflationary environment). To be fair, there are some other types of competitive advantage that we will analyze in next articles.
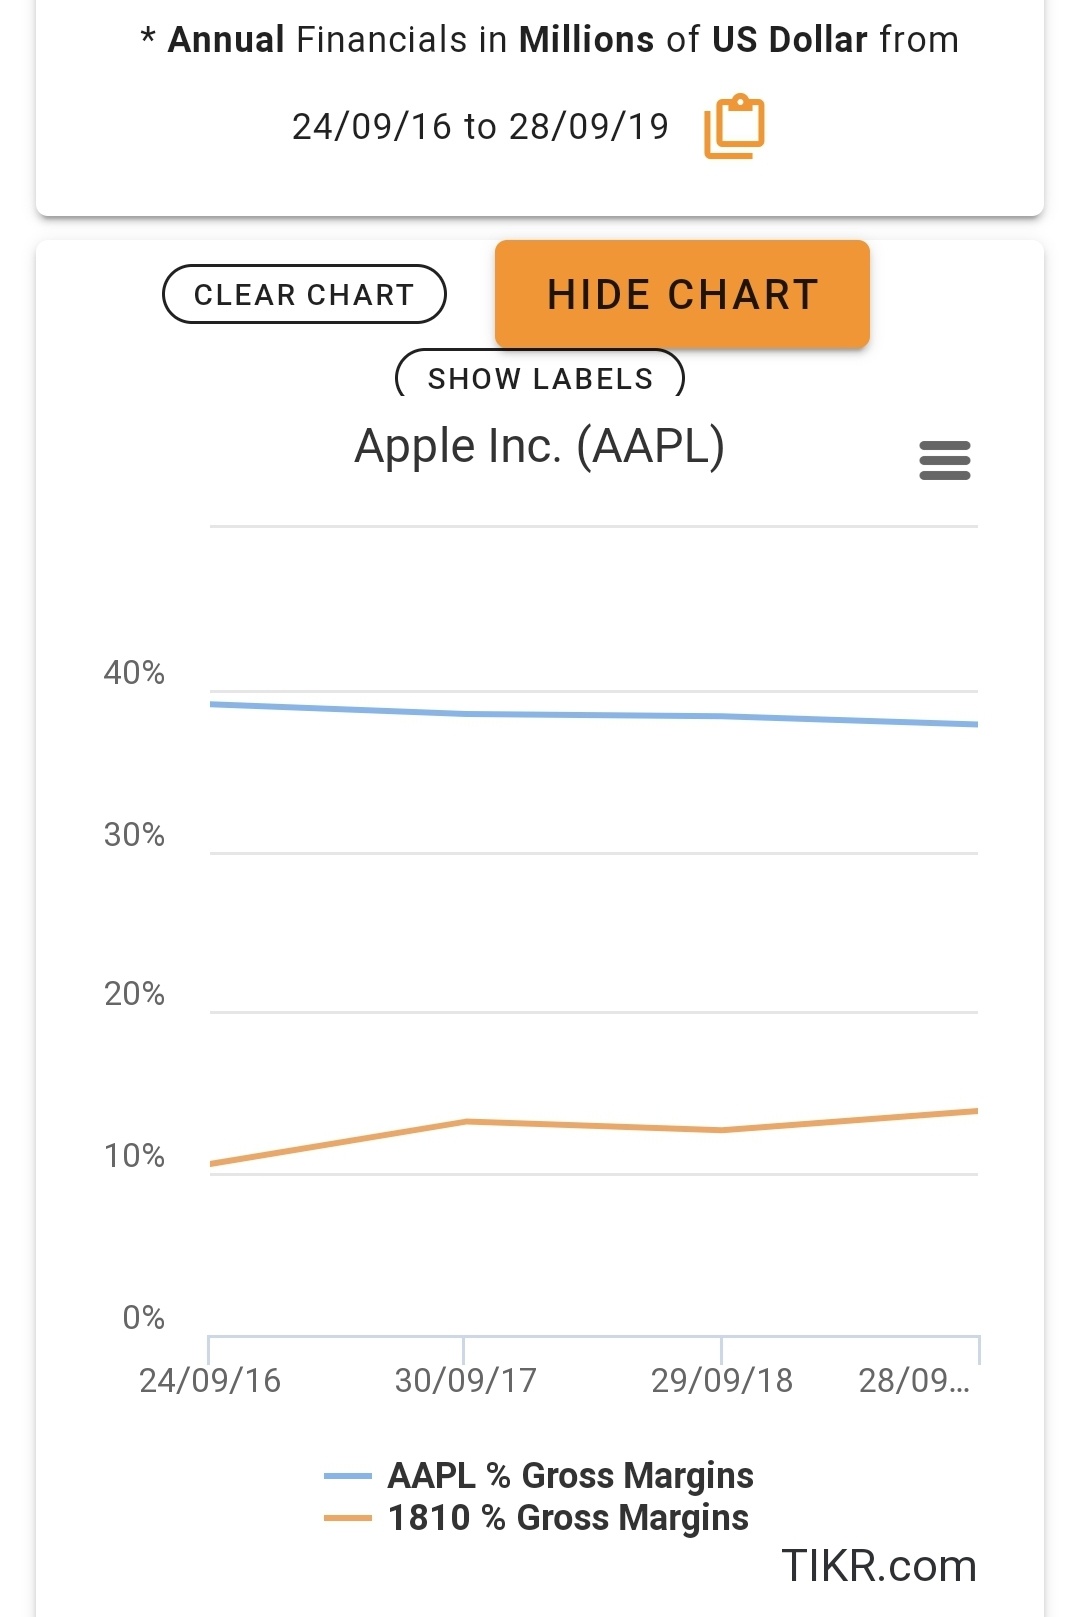
As we can see in figure 4, Apple gains a lot more cash on the total sales thanks to its globally very known brand. To be honest the two figures (Apple/Xiaiomi profit margin) show the overall company’s margin. To draw a precise figure about the smartphone sector we should decompose the various sectors, but I think this is a sufficient approximation for the purpose of this article.
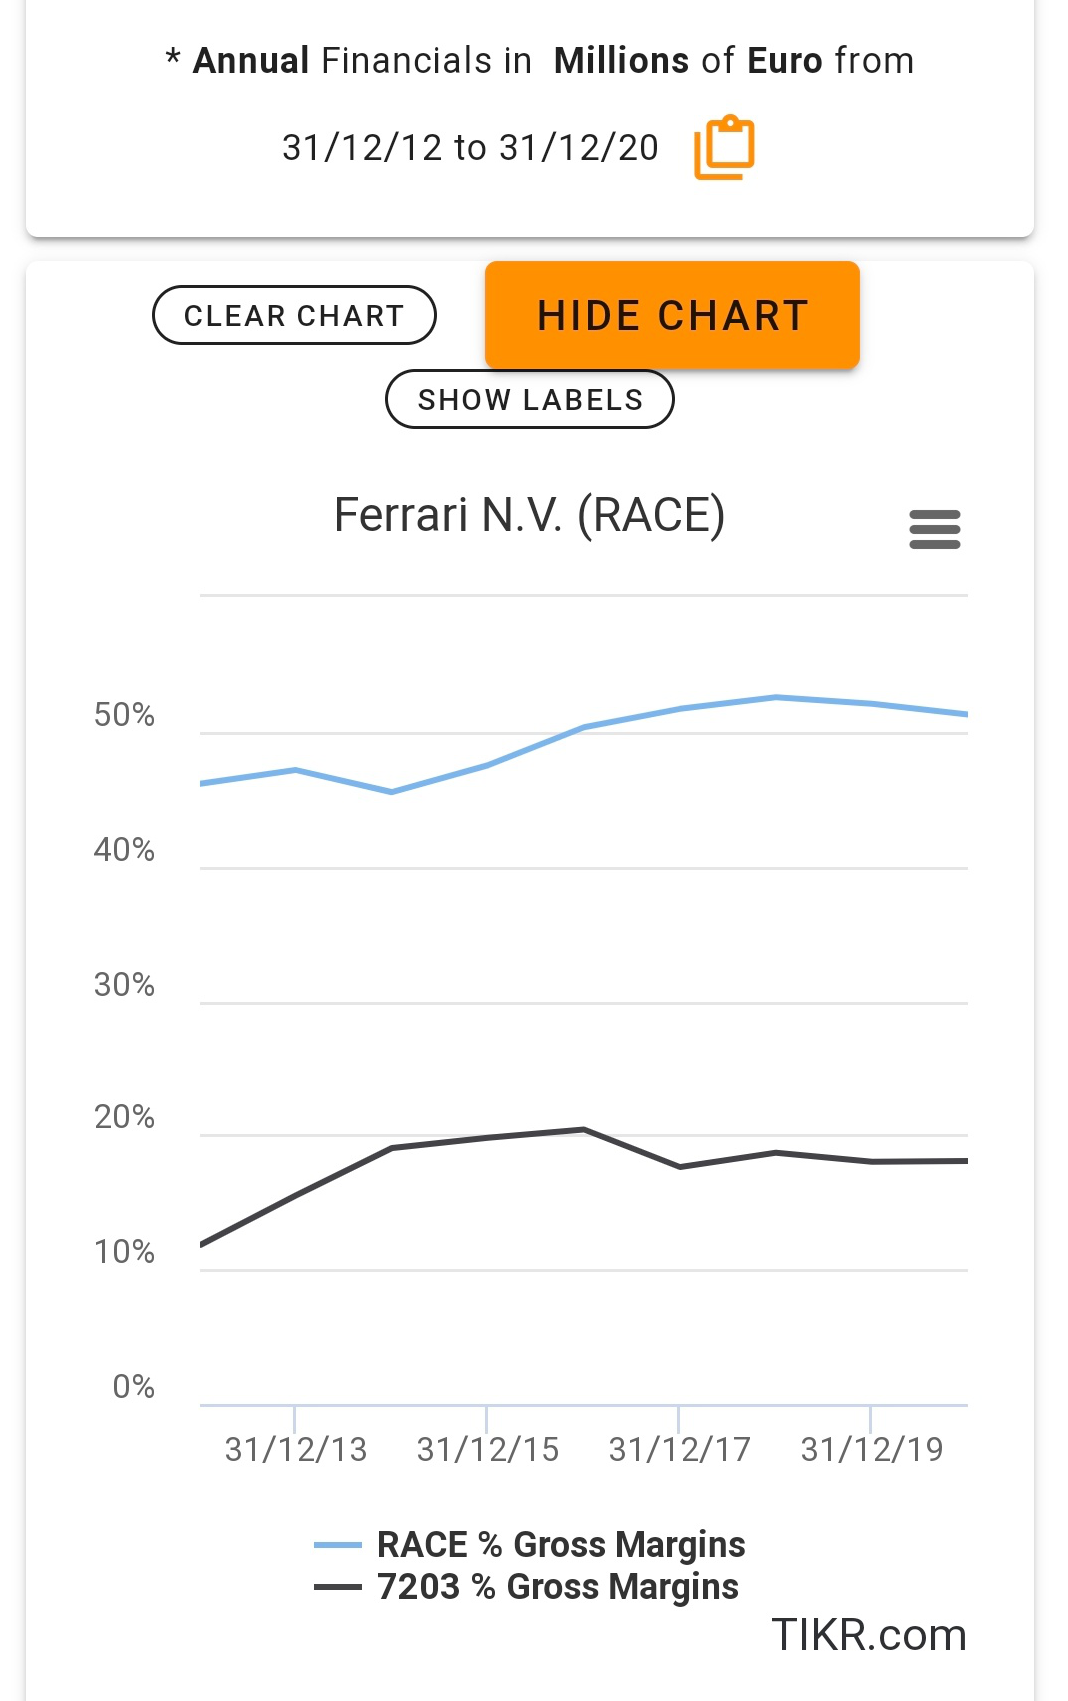
Gross margin % tells us even if a company can absorb the systemic crises that sometimes occur in the broad economy. If a product is really needed by the population, people are willing to buy it even in the middle of a crisis, even if there is a liquidity crisis and the people have less money in their pockets.
The notion of “need a product” doesn’t mean exclusively that people can’t physically live without, but could mean that their mental well-being depends on this specific object, this because marketers are doing well in the task to manipulate future customer brains to the point that in a crisis they need a branded product (Remember who brings the gifts at Christmas?). Thanks to these mechanics, the company is able to maintain the same price or even higher, and, in the meantime, it is able to sustain the same degree of sales.
Now we have our first important metric Gross Margin.
There are tons of numbers and metrics useful, but we have only one brain, so the best thing to do is try to cut down our cognitive load.
“Everything should be made as simple as possible, but no simpler.”
Albert Einstein
That’s my goal with this blog.
Another important line in the statement is Research and Developments (R&D), which includes the costs of the activities that companies undertake to innovate and introduce new products and services. R&D defines how much the company has to pay to remain competitive in his industry, typically tech companies have to spend a lot of money in order to develop new products and retain customers. Some industries are heavily technologically competitive, so the company has to constantly innovate in order to maintain the advantage or to gain it (14.it’s a war).
Net income is the bottom line on the income statement, it represents what remains after all expenses are subtracted. Retaking the precedent allegory about fuel, net income is the results after the combustion, the useful energy left and hopefully transferred to the shareholders.
As usual we are prone to find good management, a good management doesn’t use our cash in lavish manner, rather it strives to be frugal, this attitude can be seen through the Selling General & Admin Expenses (SG&A). SG&A tells us the costs incurred managing the company. It is useful to compare the trend, the numbers and the relations between SG&A and other figures like revenue, for example the % of SG&A compared to revenue in the past years.
Below is an extract from the book “The Outsiders”, where the author highlights the importance of frugality as a quality of an outstanding CEO.
“A story from this time demonstrates the culture clash between network executives and the leaner, more entrepreneurial acquirers. ABC, in fact the whole broadcasting industry, was a limousine culture—one of the most cherished perks for an industry executive was the ability to take a limo for even a few blocks to lunch. Murphy, however, was a cab man and from very early on showed up to all ABC meetings in cabs. Before long, this practice rippled through the ABC executive ranks, and the broader Capital Cities ethos slowly began to permeate the ABC culture. When asked whether this was a case of leading by example, Murphy responded, “Is there any other way?”
William N. Thorndike, The Outsiders: Eight Unconventional Ceos and Their Radically Rational Blueprint for Success
Finally, net income must be positive! I remember you, our purpose is to find the best company and don’t lose money. More years of profit means that management has done its work well, and it i’s a point in favor of the reliability of the future direction. If the machine works proficiently the money will be transferred to shareholders in a predictable way, like the coupons of a bond.
From financial datas we can extrapolate some ratios; a ratio is a relation between financial or unit data. The goal in this case, is to compare companies between the same industry or the same company in different time frames. That’s defined as “Relative valuation”, relative because it is a comparison.
Relative valuation is opposed to Absolute valuation that refers exclusively to the current data of the company we are analyzing. Absolute valuation is the main path we are going to use in order to define the fair value to pay for our business, that will be the topic of a more in depth analysis during the course of this blog.
The most useful metrics, based on what we have learn until now, are the following:
Price (market capitalization) / Sales (revenue) = P/S
[(Sales – Cost Of Good Sold) / Sales]*100 = % Gross profit
It’s a good sign whether the company grows its sales and its gross profit, despite what most people think, isn’t necessarily an astonishing growth, even a modest growth is sufficient, as long as it is accompanied by growing profit margins.
What makes the difference is the cash returned over the cost to financing our engine, in other words, the return of capital. The difference between how much the company pays for the capital and the cash returned, it’s what we retain as owners.
What does it mean?
Money isn’t free (even if we are in a free money environment, zero interest rate), the company has to pay to borrow money and has to return capital to shareholders in order to receive their money (that is what we expect as owners). Then the return from the money received has to be higher than the cost (the company has to pay to obtain this money), otherwise the company is burning money and we are going to lose the money we have invested.
Remember: investing is about the future not the past, a good trend tells us that the management has done a good job in the past, but what counts are the stories about the future.
Another useful, but sometimes overemphasised metrics, is
EPS Earnings per shares, i.e. Net income divided by the number of shares outstanding. EPS is the main Wall Street figure when it comes to value a business. Analysts are always prone to predict EPS quarter by quarter (for us, as value investors, a quarter data set is meaningless, we invest for the long run). It is entirely possible for EPS growth, even if revenues are stagnant or in decline, because the management can work to improve gross margins or profits margins.
The second piece of the puzzle are buybacks (7. How the companies reward us), if a company does buyback, the count of share on outstanding decrease, consequently the quantity of earnings for a single share increase, this can be a good sign or not, depend if the buyback happen when the stock are undervalued, and that is important to understand how the company finances its share repurchase (e.g., debt when the company is already over levered or free cash flow. The former is financial engineering, the latter is value creation! ).
In the future, we will be able to define a range of price for our company, then we are in the position to value if management does buyback in a constructive manner.
As you can see, a positive trend in EPS can be both a positive or negative sign, for that reason our financial analysis must include the other two statements. Anyhow, generally speaking, our stock return is tied to earnings growth over time.
Price to Earnings P/E, this metric suggests how much we are paying for a slice of the company earn (Case Study 1 – Tesla (TSLA)). It is obtained dividing Market Capitalization (share price * share outstanding) by the Net income (Earnings). Or in the case you use the price of the single share, you divide the price for the EPS. Because earnings are subject to variations, it is often more useful reasoning in terms of Price to Sales, because sales are more stable.
From here you can derive the earnings yield, in other words the percentage of money you receive annually as an investor from the business, that’s price dependent, for that reason the price you buy a stock is fundamental.
Earnings Yield is the inverted P/E or 1/(P/E). In the case of a company like Facebook (FB), with a P/E of 30 at this moment, the earnings yield is 3.3%, not too much. But FB is poised to grow fast in the future then you must add the growth rate to the equation. If I can estimate a growth rate of 15% for the next 5 yrs then the result is 18.3% total yield.
But be careful when it comes to forecast the future, be factual and conservative! Be sure about the stories that sustain your numbers, if you are unsure, be conservative and apply a wide margin of safety (ELI5: think about an elevator. It can carry 300kg, but the manufacturer will report a max carry of 250 kg in order to avoid accidents, you have a margin that protects you from errors. We are imperfect human beings trying to forecast the future, errors are unavoidable).
Please note that EPS are presented as diluted EPS, that’s because the company sometimes issues some financial instruments that can be converted under some circumstances as new stocks, when these circumstances occur there are going to be more shares outstanding and this causes a reduction in Earnings per unit of share. Sometimes companies pay their employees with stock options, that means employees have the option to obtain stock under some circumstance that could be understood as a form of wages. That is only an example of a form of dilutive practice.
The last two things I want to highlight are assets write-down and goodwill.
Assets write-down or write-off: that happens when a company must reduce partially or totally the value of an asset, that’s because for some reasons it loses value over time. It is often used to account for unpaid loans, unpaid receivables (debts owed to a company by its customers for goods or services delivered) or losses on inventory value.
Goodwill impairment, goodwill is the premium companies pay in order to buy an asset or make an acquisition, sometimes this premium is well deserved and sometimes not. A good practice, when we analyze a company, is to deepen the value of an acquisition and evaluate the skill of managers in making an acquisition. Too much write-down or impairments overtime can be a bad sign.
Good companies have a good capital allocator as CEO, then they do few or none impairments, the management works as you when deciding to buy or not a stock. Perhaps, you will pay a premium over the value of the company’s stock you are willing to buy, that’s because you see an hidden or intangible value in the company (e.g., astonishing future growth, brand awareness, etc.). Time will judge if you made a good choice. It’s always about the allocation of capital.
“If you can follow only one bit of data, follow the earnings — assuming the company in question has earnings. As you’ll see in this text, I subscribe to the crusty notion that sooner or later earnings make or break an investment in equities. What the stock price does today, tomorrow, or next week is only a distraction.”
Peter Lynch
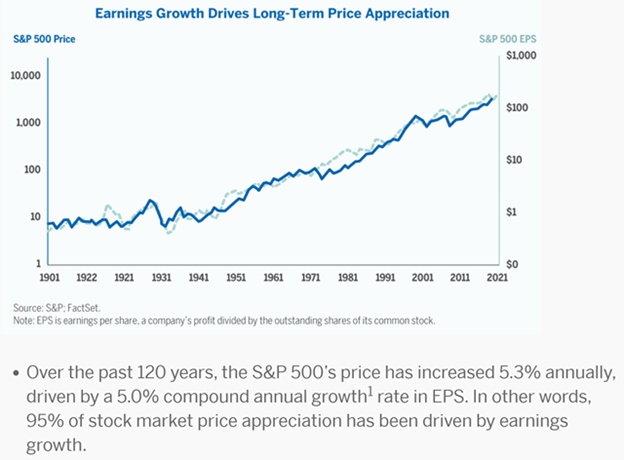
As you can see in fig. 6, Lynch’s point is supported by the datas. Like humans, businesses have a life cycle, it’s important to understand where our company stands in its life cycle.
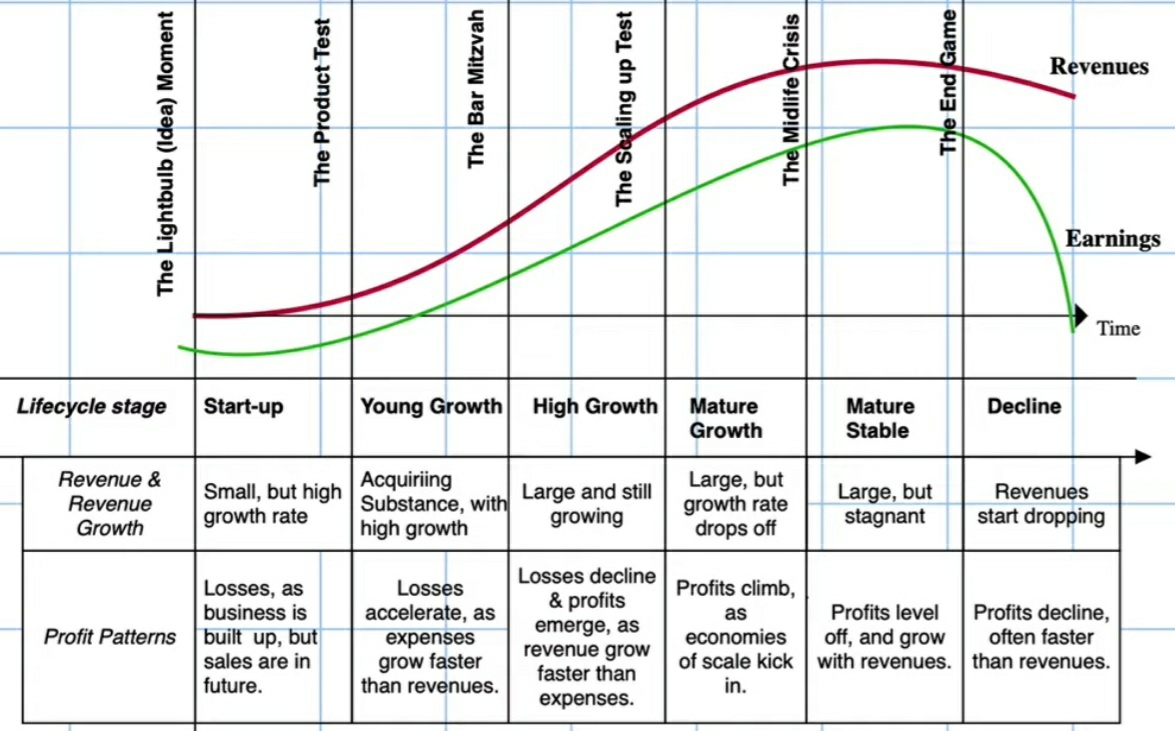
It’s useful knowing in which stage of its life the company is, in order to better understand the key metrics and what we have to expect the management must do to maximise shareholders returns.
This is my semplify thought process through the income statement. Remember that, every industry is different and there are different metrics to focus on, anyway I am trying to summarize the most important factor in the future. I will revisit my analysis of statements with a more granular focus.
To be honest, I consider the income statements the least useful of all statements.
It’s useful in order to interpret Cash Flow, for example an healthy cash generation depends on increased profits, thanks to income statements we can see the past sales trend. In the Cash flow statement we will see how these sales are converted into real cash.
Balance sheet, that is the second statement we will discover! Stay tuned!
Warning: All statements represent the past of the company, as investors we need to understand the sustainability of cash generation in the future, in order to do that we need to understand the stories behind our company (11. Stories and numbers)
Remember, our goal is to find outstanding business, buy at the right price and hold for the long run.
“Put together a portfolio of companies whose aggregate earnings march upward over the years, and so also will the portfolio’s market value.”
Warren Buffett
Feel free to comment, share my article with friends and subscribe to my newsletter if you like my content and you want to follow me towards financial freedom.
You will obtain free access to my newsletter:
- Financial education
- A open minded and value oriented mindset
- Business and sector analysis
- A stoic and calm attitude towards the market ups and downs
Free investing course index:
Following chapter 16. Balance Sheet Analysis
Disclaimer: The information contained on this website is for general information and educational purposes only. It is not intended as a substitute for legal, commercial and/or financial advice from a licensed professional.


Leave a Reply