
This is the last chapter of the analysis of the financial statements.
In my opinion, the Cash Flow statement is the most important because it describes the amount of cash and cash equivalents entering the company.
What we are going to learn:
- What is the cash flow?
- Why is it a better representation of the company’s ability to generate cash?
- Why does a Cash Flow Statement help to avoid financial fraud?
- Its role in calculating the intrinsic value of a company
- CF Equity/levered and CF Firm/unlevered
- Some useful metrics
- Cash flow in the context of the maturation stage
As we saw in the first article, the income statement uses the accrual basis accounting, in other words, it tries to match revenues and expenses at the time when the transaction occurs. The cash flow statement recognizes the transaction when the money is transferred.
This absence of further manipulation, sometimes, defines a more honest picture of the business, for that reason I particularly like this statement, and it’s a good idea to always reason in terms of Cash in and Cash out.
I used the engine allegory to define the income statement, but the real fuel of our company is represented in the Cash flow statement.
The energy generation of an engine depends on the efficiency of the system, indeed electric motors are more energy saving, than internal combustion engines (ICE). The latter are also known as heath engines. In thermodynamics, a heat engine is a system that converts heat to mechanical energy, as is the case for the ICE because this engine work by burning fuels to release heat through chemical reactions and eventually producing mechanical thrust.
But,what does financial statements have to do with thermodynamics?
Because we are going to search for the engine with less energetic dispersion, in other words, the more efficient company. Our money is the fuel and we want the best energetic returns for the fuel we inject.
In the Cash Flow statement we can check that efficiency.
What are some examples of “energy dispersion”?
- Wrong investments.
- Spendthrift manager (i.e, who pays for expensive headquarter, private jet, …).
- Absence of competitive advantage, which leads to tons of money burned in marketing expenses or trying to keep up with technology innovation without gaining extra cash.
- Excessive headcount.
- “Diworsification” and serial acquisitions in an attempt to expand the business and improve the cash flow, but with the result of lack of synergy and less efficiency.
(Watch out from CEO with expansion feticism, they want to expand their power on new lands but with detriment results for shareholders, maybe because his compensation is based on the rate of growth).
“More value is destroyed by acquisitions than any other single action taken by companies”
Aswath Damodaran, NY University
Cash Flow

“Look, son, at the end of the day it is all about cash-in, and cash-out”.
Nomad Letter 2011
The logic behind the Cash Flow statement is simple, we have:
- Cash Inflow: Revenue from goods and services, loan receipts, cash dividends, interest earned, asset sales, grants, any form of cash received.
- Cash Outflow: Payroll, capital expenditures, supplier payments, taxes, commissions, interest paid, costs tied to the operations, rent, debt payments, equity investment, repurchase of common stocks, dividends.
Ideally, our goal as investors is extracting cash overtime from our business, as a landowner wants to extract rents from his tenants through the collection of rents.
As I said, engine fuel gives us kinetic energy through chemical and physical processes. Thanks to the income statement and the cash flow statement, we can check how much energy goes wasted in the process of generating our wealth. We are going to scan our engine with a thermal visor detecting money dispersion and managerial inefficiency.
You can think of companies as a wealth engine, differently from an ICE engine, our engine will compound over time making us rich, in article 7. How companies reward us we already covered this point.
The ultimate goal of the free market is efficient capital allocation (long-term efficiency!). Your goal is to rationalize your cognitive process in order to discover efficient allocation, the engine with less energy dispersion, and a modern and efficient electric engine.
You are part of the free market engine of this world! You are voting with your feet, in this case with your money!
Another thing to consider, is that cash flows are said to be harder to manipulate than earnings, so many investors tell you to just ignore earnings and look at the cash flow statement instead.
I usually look first at the income statement, and if it is interesting I dig deeper and take a look at the Cash Flow Statement.
Qualitative earnings convert a great portion into cash flows, frauds usually report strong earnings numbers, but generate little cash, it is a red flag. This happens because the accrual method lends itself to be easily manipulated, unlike the cash accounting (which hidden some traps too).

Enron was an American energy, commodities and service company. Enron filed for bankruptcy in late 2001 after a series of financial frauds.
Here some good examples where you can spot anomalies thanks to the Cash Flow Statements.
Washington Post 2002 Enron article
Cash Flow isn’t the whole story but could be a good starting point to spot accounting shenanigans.

For a deeper analysis on frauds and financial tricks I recommend the following book:
Financial Shenanigans: How to Detect Accounting Gimmicks & Fraud in Financial Reports
Howard Mark Schilit
Other excellent reads can be viewed in my Books article.
Operating Cash Flow

As you can see from the Damodaran scheme, we use the indirect method to reach our Operating Cash Flow figure. In other words, we start from Net income and we add back non-cash expenses.
Operational Cash Flow represents the cash generated by the company business operation, in this sense in my opinion is the most important part of the statement.
The Cash Flow Statement has another advantage respect to the income statement, since it is an honest representation of the cash generated by the company in a given period it leave out non-cash expenses (e.g D&A Depreciation and Amortization, SBC Stock based compensation) and some gain unrelated to the operation of the business, as is the case for the gain of the marketable securities investments.
It is worth highlighting that D&A and SBC are real costs, then it’s important to add capital expenditure back as we will see in the section related to Free Cash Flow.
Unfortunately a recent policy change adds the capital gain of securities, like for example stocks, in the income of the company.
“Benefit users by providing a more relevant measurement attribute for equity investments through the requirement of equity investments (except those accounted for under the equity method of accounting or those that result in consolidation of the investee) to be measured at fair value with changes in fair value recognized in net income.”
FASB.org ASU 2016-1
Given its huge collection of equity securities Berkshire Hathaway could be a good example, since the introduction of the new policy its net income has become more unstable.

“The new rule says that the net change in unrealized investment gains and losses in stocks we hold must be included in all net income figures we report to you. That requirement will produce some truly wild and capricious swings in our GAAP bottom-line. For analytical purposes, Berkshire’s ‘bottom line’ will be useless.”
Warren Buffett, 2017 letter to shareholders
As we said Mr Market (article 8. Mr Market) is a fickle guy: the appreciation of the market value in the short term does not tell us anything regarding the company we are analyzing.
In this case we can rely on the operating cash flow in order to obtain a better picture

These examples show how the net income is manipulable and sometimes deceptive without the correct perspective, yet a cash flow statement is a better tool to correctly interpret the business.
Net income larger than the Operating Cash Flow is a warning sign, indeed it is defined as a red flag in the Piotroski F-Score (used to quantitatively define the quality of earnings and strength of a company’s financial position investopedia.com).
Operating Cash Flow will be the main figure when finally we will calculate the intrinsic value of our company!
“Expected long-term cash flows, discounted by the cost of capital—not reported earnings—determine stock prices.”
Michael J. Mauboussin, Morgan Stanley
Cash is always the King!
GAAP and non – GAAP
Generally accepted accounting principles (GAAP)
The GAAP is a set of accounting principles issued by the Financial Accounting Standards Board (FASB). The GAAP’s aim is standardized financial statements and allow the comparability of the financial information.
Public companies in the US must follow GAAP to compile their financial statements.
For example the Operating Cash Flow described above is a GAAP figure.
Most of the companies in the US represent their accounting figures under the GAAP accounting principle.
Non-GAAP
Sometimes companies manufacture nonstandard metrics.
Some metrics could be useful, some others could be misleading. It’s always good to stick with GAAP numbers and always be wary of non-GAAP numbers.
The most commonly used non-GAAP figure shown by management is the Free Cash Flow.
International Financial Reporting Standards (IFRS)
IFRS is the counterpart of GAAP, but adopted outside the US, as GAAP, IFRS are a set of accounting rules for financial statements of the public.
The rules of IFRS are beyond the scope of this article, to dig into the topic I suggest you read the investopedia write-up.
Free Cash Flow
An example of a non-GAAP financial measure is the Free Cash Flow.
It is an important figure, because it tells us how much money is left to pay us.
FCF = OCF +/- Change WC- CapEx
Capital Expenditure (CapEx) can be found in the Cash Flow from investing activities section, and it represents the funds used by a company to acquire, upgrade and maintain physical assets. For example property, plants, buildings, equipment and the various technologies needed in order to make the business.
Remember: not all the Capital Expenditures are created equal. The cash used to grow our business (Growth CapEx) will give us more earnings and ideally more reward in the long term (dividends, buybacks) while the cash used to maintain the business is often used to stay afloat and keep up with competitors (Maintenance CapEx).
Money machine make –
Money machine spends to keeps machine full efficiency
= Owner’s earnings
Here an important concept about owner’s earnings, initially proposed by Warren Buffett
“Calculate “owner earnings” to get a true reflection of value.”
Warren Buffett underlined the importance of making a distinction from the energy employed for growth, and energy “wasted” to simply stay afloat, as is the case for the heat generated by an ICE engine.
A company which “waste” too much money, usually, doesn’t have a strong competitive advantage, this competitive advantage takes the form of a brand which maintains a market leadership without incessantly investing to keep up with new competitors which tries to conquer the market (15. Income Statement – Mindshare).
As we saw, Capital expenditure could be divided into Maintenance and Growth.
Rarely, companies show two different figures. Often we have to estimate it (my suggestion is to always be conservative). We have to deeply understand our business to draw a line between the two Capital Expenditures. What interests us, as investors, is the cash will arrive in our pockets in the future. That cash arrives in the form of dividend, buybacks or even investment for the future expansion.
As explained in the last chapter (16. Balance Sheet Statement – ROIC), the Return on invested Capital (ROIC) represents the return on the capital the company invests in the business.
If a company has a high ROIC (15%+) we can expect this as our future stock return, then if they can maintain this level, as intelligent investors, we prefer that the company spends the cash generated in order to fuel new projects which expand the business and the future Cash Flow.
Indeed the math behind the company growth is:
g = ROIC * RR
g = growth
ROIC = Return on invested Capital
RR = Reinvestment Rate (which is the % of Net profit reinvested)
Eventually, we want to obtain even more cash per unit (stock) by means of buybacks (shrinking the piece of the pie) or reinvestment in high ROI investments which increase the future cash flow (increase the cash per share, which eventually, in the late stage of the company, will lead to buybacks, which in turn lead to even more cash flow per share and ultimately lead to a huge cost basis dividend per share).
The logical consequence is that, if a company can’t find opportunities to reinvest the money at an high ROIC, repurchasing their own stocks could be a better idea in order to increase owner’s value, if the stock is already overvalued the last thing to do is payout the Cash in the form of dividends.
FCF Equity (Levered CF) and FCF Firm (Unlevered CF)
There are two types of FCF: levered and unlevered.
- Levered reduces the FCF taking into account financial obligations (debts)
- Unlevered free cash flow is before mandatory debt payments are paid (lenders, investors, interest, etc.).
Levered free cash flow is cash left after paying all the debt due during that period (scheduled interest, principal payments and fee), whereas Enterprise Value (already discussed in the article 16. Balance Sheet) is market cap adjusted for all debt and cash/cash equivalent.
- At the end of the day, FCFF (Firm) is the cash flow owned by stockholder and bondholders, thus tied to the value of the entire capital structure, Enterprise Value.
- FCFE (Equity) is the cash owned only by stockholders, for that reason we paired it with the Market Capitalization, namely the price paid by equity investors.
Both should give you a similar valuation if you look at the averages. In a specific year they can be very different.
FCFF (Unlevered) = OCF + Tax adjusted interest expense – CapEx
FCFE (Levered) = NOPAT + D&A – CAPEX – change NWC
NOPAT = Net Operating Profit After Tax Describe the potential cash distributed to shareholders and it doesn’t take into account debt and debt interests.
Another formula, which I personally use and will be use in the intrinsic value calculation:
FCFE (Levered)= OCF – CapEx + Net Debt Issued (Repaid)
Change in NWC is the increase/decrease the company incurred in the balance between current assets and liabilities, in other words the trajectory of the resources needed to operate the business in one year timeframe (notion already dives in the article. 17 Balance Sheet Analysis). NWC could hold or release cash, in other words if the management for example improved the inventory efficiency, could reduce the inventory and free up capital usable for rewarding shareholders or invest in new high ROIC projects.
Change in Net Working Capital = Net Working Capital for Current Period – Net Working Capital for Previous Period
Some companies have a negative working capital. For instance Redbubble Limited operates as an online marketplace that facilitates the sale of art and design products. An artist sends its design to RedBubble to put it, for example, on a t-shirt . RedBubble produces and sells this t-shirt on its marketplace, when the product is sold. RedBubble gives 15% of the profit to the artist, and retains the rest.
Here RedBubble favorable working capital cycle.

As you can see, RBL first collects the gross transaction value (GTV), and only after that it distributes the gains with the rest of the parts involved, artists receive their money only two weeks after.
RedBubble generates cash extremely quickly, receiving funds from customers before it has to pay vendors. This is a favorable dynamic for RedBubble which implies a negative working capital cycle, typical of some business models.
As usual there is always some warning signs to watch out for:
“While many investors are pleased when management says that it is “aggressively managing working capital,” you should take this as a warning sign that recent CFFO growth may not be sustainable.”
Financial Shenanigans: How to Detect Accounting Gimmicks & Fraud in Financial Reports by Howard Schilit
Cash Conversion Cycle (CCC)
To better understand the flow of cash in the Working Capital, it’s a good idea to dig into the Cash Conversion Cycle.
CCC is used by management to see how long the company’s cash remains tied up to its operation.
CCC = DIO + DSO – DPO
Cash Inflow:
DIO, Days Inventory Outstanding = the average number of days the company holds its inventory before selling it
DSO, Days Sales Outstanding = the number of days of average sales the company has outstanding
Cash Outflow (because of that ->minus sign in the formula):
DPO, Days Payable Outstanding = The average number of days the company takes to pay its bills.
A short CCC means better efficiency in the cash generation, freeing cash to make additional purchases or pay down outstanding debt.
FCF per share – FCF/shares outstanding
We had already discussed metrics which describe the profit per share, as is the case for Earning Per Share (EPS). I already extolled the Cash Flow Statement, then I cannot fail to mention the equivalent of EPS but using Cash Flow instead of Earnings. The advantage of using a “per share” metrics is the incorporation of the change in the number of outstanding stock(share dilution – more slices of cake 🙁 / share repurchase – less slices of cake 🙂 ).
It is always good to check the revenue in order to understand if the business is growing (even slightly), if it is the case, shrinking the number of shares helps to further increase your ownership of the company profits. Otherwise, if the Revenues are drastically and inexorably declining, it could be a melting ice cube – red flag. More research is needed (some companies are declining but the gross margins are increasing as the case for BTI – Tobacco company).
Be careful: in the extreme case of the liquidation of a company the Cash Flow could increase, but obviously is a liquidation process of a failing business (Value Trap), for that reason it is important to look at sales growth in the income statement.
“Teledyne return, which by averaging cash flow and net income for each business unit, emphasized cash generation and became the basis for bonus compensation for all business unit general managers.”
William N. Thorndike Jr., The Outsiders: Eight Unconventional Ceos and Their Radically Rational Blueprint for Succes
A good management understands the importance of the Cash flow, and aligns the incentives of employees with those of the stockholders.
Cash Flow Yield
Market Capitalization / Free Cash Flow
As we did with P/E,we have to take into account growth in our yield, as usual when it comes to growth we need to understand the story behind our numbers and it is always a good idea to be conservative.
Cash Flow Yield = Mk cap / FCFE + growth
There are two main ways to see a company:
- from the equity side (just shareholders),
- from the company side (what you would pay to buy the whole company = shares + debt).
P/FCFE is the most common valuation from the point of view of the investors. P is the market capitalization so it ignores debt, and Cash Flow is the levered FCF.
EV/FCFF evaluate the whole company, so it accounts for equity and debt, thus we will use the unlevered FCF.
Why is the current Free Cash Flow isn’t the whole story?
I leave the Bezos’ explanation:
“With rare exceptions, the volume increase in the short-term is never enough to pay for the price decrease. However, our quantitative understanding of elasticity is short-term. We can estimate what a price reduction will do this week and this quarter. But we cannot numerically estimate the effect that consistently lowering prices will have on our business over five years or ten years. Our judgment is that relentlessly returning efficiency improvements and scale economies to customers in the form of lower prices creates a virtuous cycle that leads over the long-term to a much larger dollar amount of free cash flow, and thereby to a much more valuable Amazon.com. We have made similar judgments around Free Super Saver Shipping and Amazon Prime, both of which are expensive in the short term and – we believe – important and valuable in the long term.”
Jeff Bezos
Tom Russo, a great investor, define it as “The capacity to suffer ” while describing an amazing business:
“We tend to benefit in life when we sacrifice something today, to gain something tomorrow. That is true for companies. That is true for individuals.”
Tom Russo
In other words, a good business sometimes sacrifices the short term margins and “cash reward” (FCF → Dividends/Buybacks) for shareholders in order to improve the MOAT (somebody says “Alibaba”?).
As is the case of the first years of Amazon.com, when the smart CEO shared the profit with the customers (Costco is another good example), improving the sales volume or pouring tons of money in Research & Development with the goal to create a more efficient company which will pay more FCF in the future.
As explained, efficiency and scale are the keys.
If you remember, I often cite patience as a virtue of a good investor, this is why it is so important (long term horizon = wealth creation for society and for owners).

Walmart (WMT) is another good example, it went public in 1970. They generated positive earnings along the way. But they went FCF positive in 1997. If you had waited for Walmart to be capable of returning cash back to shareholders, you would have missed multiple hundred-baggers.

In the formula of FCF Yield, for example, the current FCF could be sacrificed in order to obtain more growth.
That said, I reiterate the importance of connecting the numbers with the stories. The story with Amazon, it’s about a brilliant CEO founder with lots of good ideas. Where, by investing all the cash available, he was able to generate and find future profitable projects, and a huge tailwind (e-commerce/cloud secular trend).
Profitability is the key, but it is important remembering that is a by-product of sales growth in the long run.

Depreciation and Amortization
D&A are non-cash expenses, in other words the depreciation of an asset is an accounting figure created to match the expense with the related revenue generated by the contribution of the specific asset.
Since the accounting nature of D&A does not really represent the cash influx, as we saw in the FCF section, we add the accounting figure, and we subtract the entire sum when the expense happens (CapEx).
Stock based compensation (SBC)
OCF added back SBC as a non-cash expense whereas net income subtract it.
“Buffett believes that the best boards are composed of relatively small groups (Berkshire has twelve directors) of experienced business people with large ownership stakes. (He requires that all directors have significant personal capital invested in Berkshire’s stock.) He believes directors should have exposure to the consequences of poor decisions (Berkshire does not carry insurance for its directors) and should not be reliant on the income from board fees, which are minimal at Berkshire.”
The Outsiders
Nassim Taleb proposed the notion of Skin in the Game.
“If you do not take risks for your opinion, you are nothing.”
Nassim Nicholas Taleb, Skin in the Game: Hidden Asymmetries in Daily Life
Personally, I want a decision-maker (CEO) who loses money as I lose money. If s/he fails to make the right decision about the future of our business.
This is called the principal-agent problem, and it arises when who makes the decision on an asset, s/he is not the same as who owns the assets, then the likelihood of a moral hazard increases.
Openinsider.com permits to check buy and sell positions of management and employees.
For example, Steve Jobs took a salary of $1 from 1997 to 2011. However, during this time his stocks increased from $17.5 million to $2.2 Billion.
Another signal of skin in the game, is a founder leading a company, a founder who invests a lot of time and energy, his work and energy often goes further than the grit of a hired CEO.
“We have ended up with a portfolio of owner-managed businesses as a byproduct of our assessment of the quality of the people involved. In other words, these managers earned their way into the portfolio. We feel slightly foolish for not recognizing this trait in advance, but, of course, we would have a bias toward founder-managed businesses (duh!).”
Nomad letters, Nicholas Sleep
Usually stock buybacks are welcomed with exultation by investors, interpreted as a net gain for owners, the reality often is that these buybacks only compensated for the stock issued as a payoff for management and employees (nothing wrong with this, but SBC is a real expense).
So far, I have spoken highly about buybacks (Berkshire Hathaway is good example), indeed I think share repurchase is a useful tool in order to reward shareholders, but you have to dig about the balance between share issuances and share repurchase in order to understand if there is a real gain for us, or only an escamotage, adding back SBC to OCF could be a viable alternative.
“To say “Stock-Based Compensation” is not an expense is even more cavalier. CEOs who go down that road are, in effect, saying to shareholders, “If you pay me a bundle in options or restricted stock, don’t worry about its effect on earnings. I’ll ‘adjust’ it away.”
Warren Buffett
Cash flow from investing activities

Capital Expenditure
I anticipated this figure in the section related to the Free Cash Flow, as already said, CapEx are the investments that companies make to grow or maintain the business.
CapEx is depreciated in the Income statement over the useful life.
Expenditures and expenses obviously depend on the sector, some sectors have high costs, caused by the need of a lot of raw material/buildings/marketing. A good example of a heavy capital expenditure sector is the airline business (other examples are automobile manufacturers, oil/gas production, steel, telecommunication, railways, …).
On the other hand, some businesses tied to software or web platforms, like for example Meta (Facebook), have low capital expenditure and high scalability (Asset light companies).
Cash flow from financing activities

Debt
The debt section represents the issuance or repurchase of debts, it is useful to understand the capital structure of the business, issuance of debt increases the Cash Flow in the short-term, but with some caveats, risks and the effect of decreasing future Cash Flow by the amount needed to service the debt. It’s important to understand the capital structure and be conservative when it comes to the value of the debt burden. It’s also important to understand the purpose of the debt. I analyzed the debt question in the article on the Balance Sheet.
As useful metric to understand at glance the sustainability of the debt burden is the following:
Cash Flow to Debt = Cash Flow from Operations / Total Debt
A high ratio suggests that a company is able to pay back its debt and consequently take on more debt if necessary, this metric varies widely across industries.
Issuance/repurchase of common stock
Issuance of common stocks could be a warning sign, as just explained, over time our goal is to own a biggest slice of the cake. If a company is overpriced an able management could issue more shares in order to obtain cash for investments, consequently this means that the shares are overpriced then we have to re-value our position.
Here the notion to reiterate is that if the company has the chance to invest money in a high ROIC venture, it is better to do it than to repurchase the stocks, it’s alway a matter of capital allocation and opportunity cost.
Common dividend paid
Cash Dividend Payout Ratio = Common Stock Dividends / (Cash Flow From Operation- Capital Expenditure)
It’s better to use Cash Flow because Earnings as an accounting figure is easily manipulated.
Here it is worth paying attention to the % of FCF distributed as dividend, if the % is too high, or worse, it is more than the FCF, maybe the dividend if financed through debts, this is a warning sign. Financing a dividend with debt is the recipe for big problems and a warning sign.
Value trap: a decadent business which tries to retain shareholders offering a juicy, but unsustainable dividend, maybe it works in a 0% interest environment, until the music stops.
“I have a certain distrust of firms with generous dividend policies, and so should you. Consider a firm with $5 million in “excess” cash. If a healthy operation, it might use the money to fund research and development; or to lower the price of its product so as to increase market share; or for many other operations to enhance the value of the enterprise. Suppose, however, that it can’t find anything in the company worth the investment. That firm might be thought of as having reached a dead end. And in such a case, it might increase the dividend to placate shareholders and stave off takeover artists.”
Quality of Earnings, Thornton L. O’Glove
That said, it is worth remembering that in every stage of the business life you can make good money, this always depends on the CEO’s capital allocation ability and interest alignment aka Skin in the Game.
“Pre-Paid Legal grew rapidly throughout the 1980s and 1990s. What’s interesting about the company is that after this strong initial growth, its revenues have been virtually flat over the last ten years. This pattern of rapid growth followed by a sudden and extended flattening in results has historically been a recipe for horrific stock market returns. Over that same period of time, however, Pre-Paid’s stock appreciated fourfold, dramatically outperforming both the market and its industry peers. How did the company achieve these results? Starting in late 1999, its CEO, Harland Stonecipher, realized that his market was maturing and that additional investments in growth were unlikely to have attractive returns. At the urging of his board (which, unusually for a public company, included several large investors), he began a systematic and aggressive program of optimizing free cash flow and systematically returning capital to shareholders through an aggressive stock repurchase program. Over the next twelve years, Stonecipher bought in over 50 percent of shares outstanding, to the sustained applause of his shareholders and the stock market, and in June 2011, agreed to sell his company to a private equity firm for a significant premium”
William N. Thorndike Jr., The Outsiders: Eight Unconventional Ceos and Their Radically Rational Blueprint for Succes
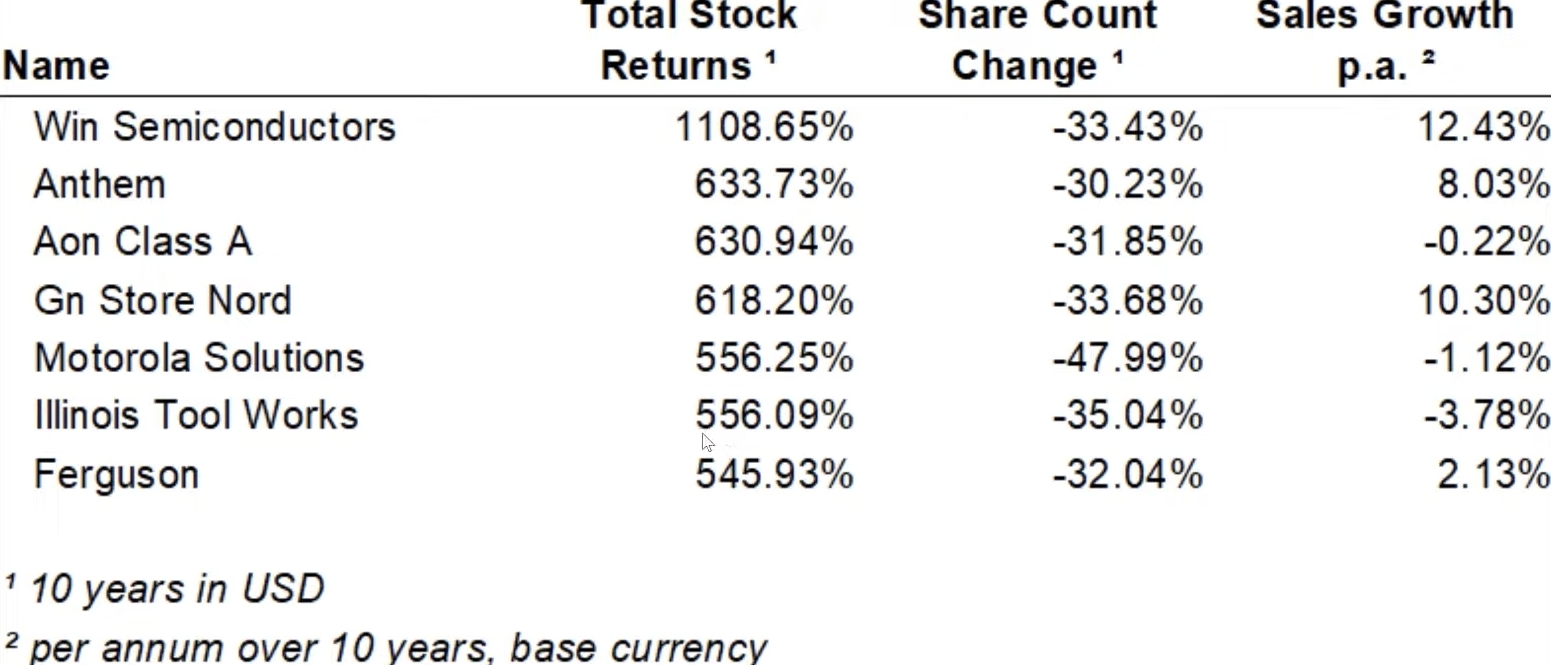
TSR (Total Shareholder Return) is not always a matter of sales growth. A share float shrink achieved through a share buyback is an excellent alternative for a stable FCF. Few or no opportunities to invest it at a compelling ROIC are usually a sign of the company’s maturity stage.
Net Change in cash
Once we have all net cash balances (Operating, Investing, Financing) we sum them up and obtain the Net Cash for the given period, adding it to the opening cash balance and we arrive at the closing cash balance in the Balance Sheet under the Current Asset section (16. Balance Sheet Analysis).
Here a summary of the cash inflow and outflow in a real case, followed by the context in the life stage of the company.

As usual, I attach the Damodaran chart of what we could expect as investors, in every stage of the company’s life from a Cash Flow standpoint.

Key takeaway:
- Owner’s Earnings
- EV/FCFF and CF yield as comparative metrics
- CFO to Debt as a sustainability metric
- Some free cash could be sacrifice today in order to widening the moat
- FCFE to calculate intrinsic value, remember it for the next chapeter 18. Intrinsic Value
- Share repurchase Vs SBC
Well, we have finished the study of the three statements:
I tried to put some colors to these statements with an investing perspective.
In the next article I will tell you what we learned until now, in order to define a range of prices for the companies we are analyzing. As I anticipated, I give importance to the future cash flow of the company, but future cash does not have the same value as the cash in our pocket today.
“A bird in the hand is worth two in the bush”
Warren Buffett
In other words, a sum of money is worth more now than the same sum will be at a future date, because of uncertainty and opportunity cost, meaning the opportunity to invest in other companies with better cash flow related to their price.
The future is inherently uncertain and we have to understand which investment gives us the best mixture from a risk/reward standpoint.
Feel free to comment, share my article with friends and subscribe to my newsletter if you like my content and you want to follow me towards financial freedom.
You will obtain free access to my newsletter:
- Financial education
- A open minded and value oriented mindset
- Business and sector analysis
- A stoic and calm attitude towards the market ups and downs
No noise, only signal and high valuable contents
“Everything should be made as simple as possible, but not simpler.”
Albert Einstein
Free investing course index:
Following chapter:
18. Intrinsic Value – Discounted
Related articles:
Case Study 2 – Berkshire Hathaway
7. How the companies reward us?
Disclaimer: The information contained on this website is for general information and educational purposes only. It is not intended as a substitute for legal, commercial and/or financial advice from a licensed professional.
Leave a Reply